
The Story of Scaling Up
Introduction
Access to middle-class jobs increasingly requires a college degree or credential. College graduates earn more, are less likely to suffer job losses in a recession, and are projected to have superior long-term labor market prospects.1 In Boston, the college graduation rate for the city’s public high school graduates increased from 39 percent in 20002 to 52 percent in 2011.3 Nevertheless, challenges remain. The graduation rate is likely still not sufficient to meet the predicted demand for a college-educated workforce. Furthermore, students from low-income households, first-generation students, and racial/ethnic minorities are typically underrepresented in postsecondary education.4
The Success Boston initiative was launched in 2008 specifically to improve Boston public high school graduates’ access to and success in college, particularly for members of groups traditionally underrepresented in college degree attainment. Higher college graduation rates, in turn, are expected to increase students’ access to employment in such local industries as technology, financial services, higher education, and health care that routinely require advanced training.
The Success Boston initiative unites the Boston Foundation, City of Boston, Boston Public Schools (BPS), University of Massachusetts Boston, Bunker Hill Community College, other regional colleges and universities, and local nonprofit organizations in a concerted effort to improve college completion rates for Boston public school graduates. The partners focus on boosting college persistence and ultimately improving college completion rates for these graduates through a purposeful combination of program, policy, and practice-based activities. The Boston Foundation is the convening “backbone” organization of the Success Boston initiative; it funds and supports the nonprofit organizations that provide one of the core programs within the overall initiative: one-on-one transition coaching, or Success Boston Coaching (SBC).
SBC is designed to support recent high school graduates entering college who are most likely to leave before completion—that is, first-generation college and low-income students of color. Through this program, students can access one-on-one coaching, starting as early as the last year of high school and continuing for the first two years after high school graduation.
Since the Success Boston initiative’s start in 2008, SBC has been offered to 10 successive cohorts of Boston public high school graduates, starting with the class of 2009. In the fall of 2015, and funded in part through a Social Innovation Fund (SIF) grant from the federal Corporation for National and Community Service, the Boston Coaching for Completion scale-up broadened the reach of the SBC program from several hundred to 1,000 Boston young adults per cohort. In the first two years after the scale-up, eight nonprofit organizations provided coaching to 2,053 students attending more than 50 colleges, with 53 percent of these students attending Bunker Hill Community College and University of Massachusetts Boston alone. These nonprofit organizations, partner colleges, and the Success Boston network collaborate to provide transition coaching to support students on the path to college graduation (see Exhibit 1).
Exhibit 1: The Success Boston Coaching Model
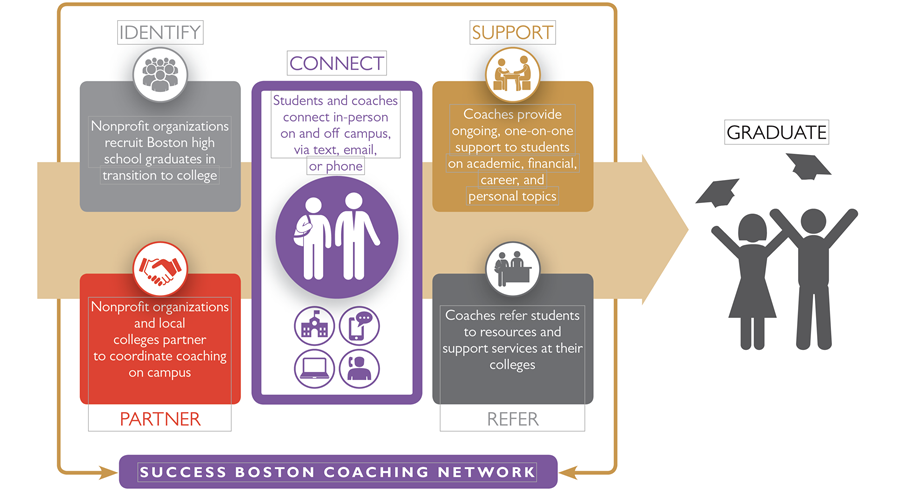
SBC coaches support students throughout the academic year and summer, offering proactive and on-demand guidance to help prepare students to navigate, increasingly independently, through to college graduation.5 They provide support on life skills, study skills, help-seeking strategies, and academic skills; they help students develop meaningful relationships, clarify goals, access networks, understand college culture, and make college life feasible; and they provide job and career mentoring. Partner colleges communicate with coaches and help coordinate coaching services on their campuses. The SBC network, which the Boston Foundation oversees, facilitates communication across organizations; it also provides coaches access to specialized training about financial aid from uAspire, a national nonprofit organization, as well as access to training on other topics.
Earlier studies have demonstrated that coaching increases student persistence and academic achievement in college.6 There is also descriptive evidence that for some students, coaching may lead to higher college completion rates.7 This SBC study aims to build on prior work by examining both the implementation and impact of SBC after the scale-up. The sections that follow provide an overview of the study design, findings, and discussion points.
Study Design
Research Questions:
This brief highlights findings from the Success Boston The Story of Scaling Up: Impact of Success Boston’s Coaching to Completion report, which answers two key research questions:8
- What is the effect of SBC on student success in college?
- How, if at all, do the impacts of SBC vary by student characteristics and features of the coaching?
Sample:
The study includes students who:
- Enrolled in college in the fall after high school graduation (either fall 2015 or fall 2016);
- Enrolled in a college in which at least one SBC student and at least one potential comparison student were enrolled in that given year; and
- Had no missing information on key baseline characteristics (free and reduced-price lunch status and high school GPA) used in the matching process.
The study sample includes up to 1,480 SBC students and 8,978 non-SBC students; the specific number of students varies by outcome due to data availability.
Analysis:
Using a quasi-experimental design, this study compares outcomes for the students who participated in SBC (“treatment” group) to outcomes of a group of similar students (“comparison” group) who did not participate.
Because the study uses a rigorous quasi-experimental design, it provides causal evidence that observed differences in outcomes between coached and similar non-coached students are due to participation in SBC.
The study also considers whether any impacts vary as a function of particular student characteristics or features of coaching. This brief highlights the results by one key feature of coaching, the frequency of interactions—the remaining analyses can be found in the full report.
Data Sources:
The study team collected data from BPS, the Massachusetts Department of Elementary and Secondary Education, and 11 partner colleges, and the SBC program database.
Outcomes:
The outcomes for this study fall into three domains:9
- Persistence (as measured by persistence into the second year and persistence into the third year);
- Academic achievement (as measured by cumulative GPA); and
- Financial aid (as measured by Free Application for Federal Student Aid (FAFSA) renewal).
The outcomes above are the focus of this brief. However, the full report also looks at three additional outcomes: full-time status, semesters enrolled in non-credit bearing courses, and credit accumulation.
Findings
Summary

The analyses estimate that SBC students have better early college outcomes than do their carefully matched peers not participating in SBC. Specifically, SBC students are more likely to persist into their second year of college (82.6 percent for SBC students in the treatment group vs. 78.3 percent for the non-coached students in the comparison group). Additionally, SBC students are more likely to complete FAFSA renewals for their second year of college (83.9 percent vs. 77.7 percent).
Persistence into the Second and Third Years of College
A key expectation of the SBC model is that students are more likely to persist in college as coaches help them navigate and manage the academic, financial, and social-emotional challenges typically faced by beginning college students. To test this hypothesis, this study uses two primary outcome measures to assess persistence: persistence into the second year of college and persistence into the third year of college.10 These persistence outcomes measure whether students who enrolled in college after their high school graduation returned to college in the fall of succeeding academic years. Persistence into the second year of college indicates whether students in the 2015 and 2016 cohorts enrolled in the fall semester of 2016 and 2017, respectively. Persistence into the third year of college reflects whether students in the 2015 cohort also enrolled in the fall semester of 2017.
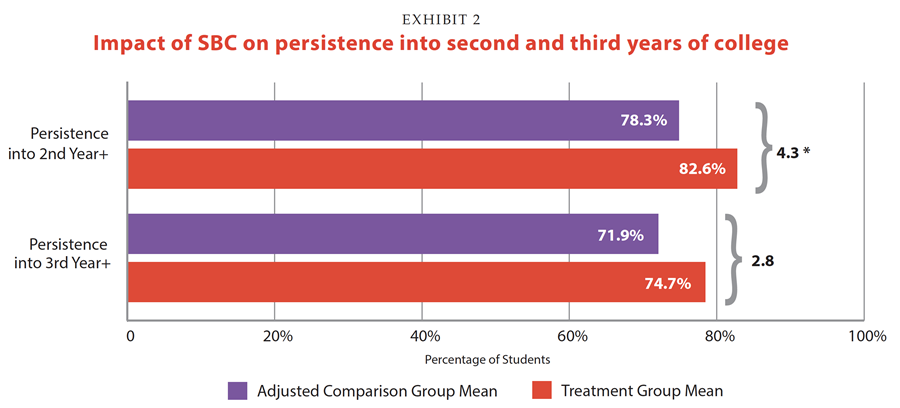
The top panel of Exhibit 2 above shows that 82.6 percent of SBC students in the treatment group and 78.3 percent of non-coached students (comparison group) persisted into the second year of college. The 4.3 percentage point impact of SBC on persistence is positive and statistically significant. This percentage point change is the equivalent of a 5 percent increase in persistence rates. Both groups persisted into the second year at higher rates than the 73.9 percent national average for students starting college in the fall of 2016 (NSC 2018).
The bottom panel in Exhibit 2 shows that the impact of SBC on persistence into the third year is not significant. (This third-year outcome is measured only for the 2015 cohort, so it should be interpreted with caution due to the smaller sample size.)11
The positive findings across the persistence outcomes are noteworthy for several reasons. First, these corroborate prior findings in the Success Boston interim impact report (Linkow et al. 2017b) as well as research conducted by Sum, Khatiwada, and Palma (2014), which found evidence of a positive and statistically significant effect of Success Boston Coaching on college persistence. Second, the findings are consistent with studies of other coaching interventions shown to improve students’ likelihood of persisting in college (e.g., Bettinger and Baker 2014). And third, persistence is an important success indicator; students must persist in order to complete.
Achievement
Another key hypothesis of the SBC study is that coaching supports can help students manage various academic challenges that they may face in college, ranging from difficult coursework to course selection and time management. By helping students access available campus supports and cope with stressors related to the academic demands of college, coaches can potentially help students improve their academic achievement.
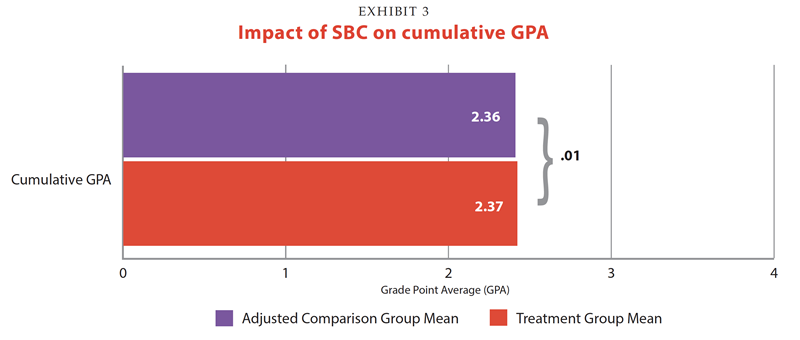
The analyses described below examine the impact of SBC on one primary outcome measure of academic achievement: cumulative GPA.12 Cumulative GPA is drawn from students’ most recent semester enrolled and corresponds with the following values: A=4.0, B=3.0, C=2.0, D=1.0.
Exhibit 3 illustrates that SBC students in the treatment group have comparable cumulative GPAs, on average, relative to non-coached students in the comparison group. Students in both the treatment and comparison groups had GPAs that fell in the C/C+ range (approximately 2.4 points on a four-point scale).
Financial Aid
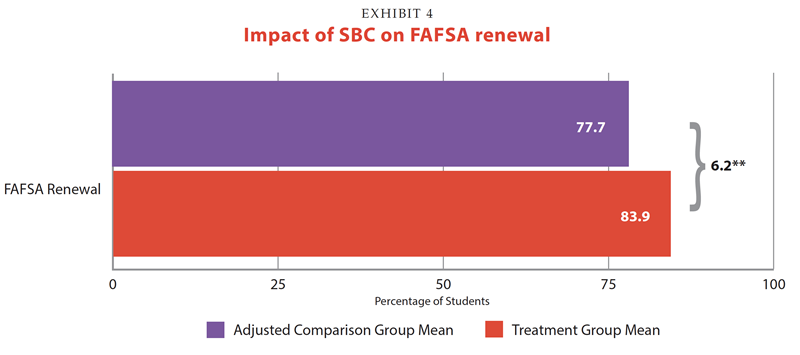
One of the goals of SBC is to help students navigate the financial aid process and presumably help reduce the gap between the cost of college and what students can actually afford. Helping students to complete the FAFSA is a key part of this process. In fact, uAspire offers training for SBC coaches on a range of financial aid and planning topics and hosts FAFSA completion events for SBC students. In 2016–2017, some 67 percent of SBC students also received text message nudges from uAspire advisors. To this end, the SBC study examines FAFSA renewal, measuring whether students complete and submit a FAFSA renewal application for their second year of college, unlocking access to federal student aid. SBC serves largely low-income, Pell Grant–eligible students; completing the FAFSA is crucial for these students to access the financial aid they need to succeed in college.
A large majority of both SBC and non-coached students renewed their FAFSA for their second year of college, reflecting the high proportion of students who are eligible for federal financial aid in the study sample (74 percent of SBC students and 75 percent of those not coached were eligible for free/reduced-price lunch in high school).
SBC students in the treatment group renewed their FAFSA at a higher rate than the students in the comparison group, and the difference in renewal rates (6.2 percentage points) is positive and statistically significant (Exhibit 4). Among the treatment group students, 83.9 percent renewed their FAFSA for their second year of college versus 77.7 percent of comparison students. This percentage point change is the equivalent of an 8 percent increase in FAFSA renewal rates.
Differences in Impacts by Frequency of Coaching
In addition to examining program impacts, the study also considers whether any impacts vary as a function of particular student characteristics or features of coaching. In the full report, differences in coaching impacts were examined by four types of student characteristics: gender, underrepresented minority status, high school GPA, and two- vs. four-year college enrollment status. It can be useful to examine differences by student characteristics when making decisions about the coaching program. For example, if a particular group of students may be most in need of coaching, or if coaching is shown to be particularly helpful for certain groups of students, program administrators may consider targeting the coaching at those groups. However, because the study did not find any consistent patterns of differences by student characteristics, this section focuses on the question of whether impacts vary by coaching feature.
This brief highlights the results by one key feature of coaching: the frequency of interactions. The remaining analyses can be found in the full report. Frequency of interactions measures the number of interactions across all modes (in-person, text, email, phone, and social media) between students and their coach across the same two-year time period as described above. To simplify analyses, two groups of students were created based on the median value: Those who fell into the “low” group had 14 interactions or fewer and those who fell into the “high” group had more than 14 interactions per academic year.
Findings show that SBC students have more positive college outcomes when they experience more interactions (Exhibit 5). Further, the positive impacts of coaching are concentrated among students who experience more frequent coach interactions. These results suggest that coaching is more effective for students who experience more than 14 interactions throughout the academic year.
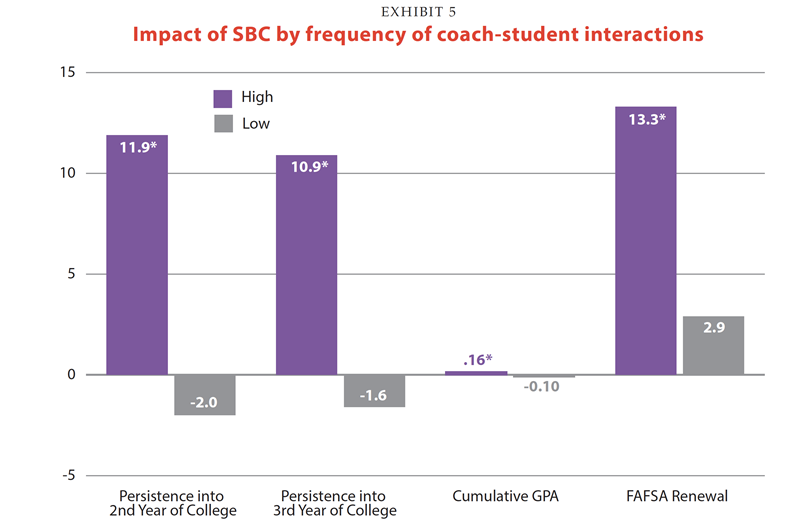
By contrast, when we looked at how impacts vary by duration of coaching interaction, we found that longer coaching interactions were no more beneficial than shorter coaching interactions, except for in the case of renewing the FAFSA. Longer interactions may be necessary for completion of the FAFSA to allow time for coaches to work through the entire application with students. On the whole, these results suggest that coaches frequently checking in with students may be more important for students’ postsecondary success than meeting for longer periods of time.
Discussion
Success Boston coaches support students to successfully navigate college, through both referrals to campus resources and direct support, across areas that research suggests can be helpful in improving student outcomes. Coaches connect students to resources such as tutoring and financial aid services, help them plan their coursework and identify a major, work with them to understand financial aid processes and options, provide them with time management and study strategies, and develop positive relationships with students.13
Perhaps uniquely so, the SBC program integrates these different features into a single intervention that is tailored to individual student needs. Core to the SBC model are responsiveness to student needs and customization of sup port to address each
student’s individual requirements for support and contact. Coaches vary the frequency, modes of communication, and focus of supports to “meet students where they’re at.”14 Though one coach may provide support across a variety of topics, any individual student may not receive support on all topics, depending on that student’s needs and interests.
The expansion of SBC did not come at the expense of how often coaches interact with students. Students in the scaled-up program typically interacted with their coaches between one and two times a month during the academic year and each in-person meeting was about 30 minutes, both of which were similar to how often and how long coaches interacted with students in the earlier cohorts.15
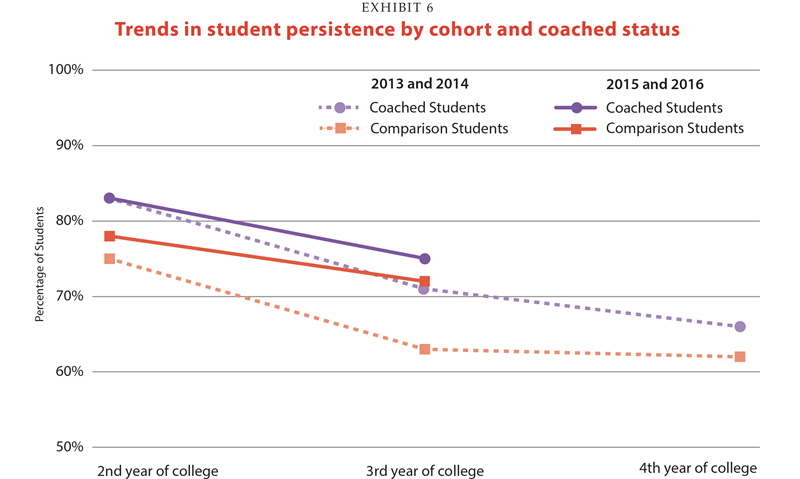
The effects of the scaled-up SBC program can be characterized as positive and moderate in magnitude. Yet the impacts found for the program at scale are smaller than those seen for earlier cohorts.16 Exhibit 6 compares the persistence rates of coached students (purple circles) and comparison students (red squares) for each set of cohorts (2013 and 2014 cohorts are the dashed lines and 2015 and 2016 cohorts are the solid lines). It may be that the shrinkage in the impact of SBC is caused by improvements in the outcomes of comparison group students (see the lines with red squares in Exhibit 6). There is some evidence that the colleges participating in SBC, in particular those that enroll large proportions of SBC students, have made changes in recent years to improve their student support services. For example, some of the colleges have established their own cadre of “coaches” to support students coming from outside of Boston; other colleges have centralized their non-academic support services to improve accessibility to students. Overall, coached and non-coached students from the 2015 and 2016 cohorts (solid lines) are persisting at slightly higher rates than students from the 2013 and 2014 cohorts (dashed lines). College changes could be improving outcomes for all students.
Even with overall increases in student outcomes, SBC continues to add value to participating students. The impact results suggest that the SBC model has meaningful and significant promise. A model in which professional coaches deliver sustained, proactive, and responsive support within a larger education network may not necessarily need to be “high touch” to accomplish the overarching program goal: to move more students more quickly and effectively along the pathway to college completion. The proactive, sustained, and adaptive advising that is Success Boston Coaching can improve the college outcomes of students who are typically underserved and underrepresented in postsecondary education.
Endnotes
- U.S. Census Bureau. 2017. Current Population Survey (CPS), “Annual Social and Economic Supplement, March 2017.” McFarland, J., B. Hussar, X. Wang, J. Zhang, K. Wang, A. Rathbun, A. Barmer, E. Forrest Cataldi, and F. Bullock Mann. 2018. The Condition of Education 2018. NCES 2018-144. Washington, DC: National Center for Education Statistics, U.S. Department of Education. Retrieved from https://nces.ed.gov/pubsearch/pubsinfo.asp?pubid=2018144
- A 2008 report, Getting to the Finish Line: College Enrollment and Graduation, a Seven-Year Postsecondary Longitudinal Study of the Boston Public Schools Class of 2000 Graduates found that 64 percent of nearly 3,000 Boston Public Schools Class of 2000 graduates enrolled in a postsecondary institution within the first seven years after high school graduation, yet only 35.5 percent of college enrollees had earned a certificate, a two-year degree, or a four-year degree. That figure was later revised to 39 percent. Sum, A., N. Fogg, I. Khatiwada, J. McLaughlin, S. Palma, N. Sullivan, and C. Smith. 2008. Getting to the Finish Line: College Enrollment and Graduation, a Seven-Year Postsecondary Longitudinal Study of the Boston Public Schools Class of 2000 Graduates. Boston: Northeastern University and Boston Private Industry Council.
- McLaughlin, J., and A. Van Eaton. 2018. Staying the Course. Six-Year College Enrollment and Completion Experiences of BPS Class of 2011 Graduates. Boston: The Boston Foundation. http://www.successboston.org/ -/media/tbf/reports-and-covers/2018/success-boston-april3.pdf
- Bailey, M. J., and S. M. Dynarski. 2011. “Gains and Gaps: Changing Inequality in U.S. College Entry and Completion.” In Whither Opportunity? Rising Inequality and the Uncertain Life Chances of Low-Income Children, edited by G. J. Duncan and R. J. Murnane, 117–132. New York: Russell Sage.; McFarland et al. 2018
- For a detailed description of how SBC was implemented in the 2015–16 academic year, see Linkow, T., H. Didriksen, B. Gamse, E. Bumgarner, M. Velez, S. Dastrup, S. Ballinger, S. Burke, M. Meneses, and R. J. de la Cruz. 2017a. Success Boston Coaching for Completion 2015–16 Implementation Report. Boston, MA: The Boston Foundation. https://www.nationalservice.gov/sites/default/files/evidenceexchange/FR_Success Boston Implementation Report_2017.pdf
- Sum, A., I. Khatiwada, and S. Palma. 2014. The College Persistence and Graduation Experiences of Success Boston Coaching Participants from the BPS Graduating Class of 2009. Boston: Center for Labor Market Studies, Northeastern University. Retrieved from https://repository.library.northeastern.edu/downloads/neu:m0407544b?datastream_id=content; Linkow, T., B. Gamse, F. Unlu, E. Bumgarner, H. Didriksen, J. Furey, M. Meneses, M. Sami, and A. Nichols. 2017b. The Power of Coaching: Interim Report on the Impact of Success Boston’s Transition Coaching on College Success. Boston, MA: The Boston Foundation.
- McLaughlin, N. Sullivan, A. Van Eaton, T. Linkow, H. Didriksen, B. Gamse, and J. Furey. 2016. Reaching for the Cap and Gown: Progress toward Success Boston’s College Completion Goals for Graduates of the Boston Public Schools. Boston, MA: The Boston Foundation.
- The implementation-focused report, Success Boston Coaching for Completion 2015–16 Implementation Report (Linkow et al. 2017a) addresses two additional research questions: How is SBC implemented across partner organizations and partner colleges? and: What resources are necessary to implement SBC? The final report, due out in 2022, will explore long-term outcomes.
- Two domains had multiple outcomes: persistence and achievement. For these domains we distinguish between primary and exploratory outcomes. Primary outcomes are those most closely related to the theory of change—and are the focus of this brief. See the full report for a comprehensive discussion of exploratory outcomes: tbf.org/scalingup-report. Exploratory outcomes include: full-time status, semesters enrolled in non-credit-bearing courses, and credit accumulation.
- As described in the full report, SBC students were also slightly more likely to be enrolled full-time relative to non-coached students in the comparison group.
- Because two primary outcomes within the single domain of persistence are tested, statistical significance tests use the Benjamini-Hochberg correction.
- The full report also examines impacts on credit accumulation, showing that SBC students also earned slightly more credits toward their degrees than the comparison group students.
- Linkow et al. 2017a.
- Linkow et al. 2017a.
- Linkow, T., K. Dadisman, B. Gamse, H. Didriksen, G. Schwartz, M. Hillard, and M. Karuu. 2015. Degrees of Coaching. Success Boston’s Transition Coaching Model. Boston: The Boston Foundation.
- Impacts on the 2013 and 2014 cohorts can be found in: Linkow, T., B. Gamse, F. Unlu, E. Bumgarner, H. Didriksen, J. Furey, M. Meneses, M. Sami, and A. Nichols. 2017b. The Power of Coaching: Interim Report on the Impact of Success Boston’s Transition Coaching on College Success. Boston: The Boston Foundation. https://www.successboston.org/-/media/tbf/reports-and-covers/2017/interim-outcomes-report-final.pdf?la=en